News
The great housing supply shortage
23 Aug 16

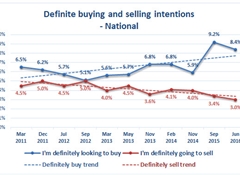
The gap between the number of people definitely wanting to buy and sell properties is the largest since Property Press started measuring it in 2010.
The latest nationwide Horizon Research survey for Property Press in July finds 8.4% of respondents saying they are definitely looking to buy a residential property in the next year.
However, just 3% say they are definitely going to sell.
This is the lowest measured since October 2010, and continues a general downward trend evident since September 2012.
Supply is only 35% of demand (assuming one property is offered for sale for each respondent who is “definitely going to sell”) and means prices are not likely to fall.

Considering buying or selling - National |
Jun 2016 |
Sep 2015 |
Nov 2014 |
Feb 2014 |
Nov 2013 |
May 2013 |
Mar 2013 |
Sep 2012 |
Jul 2012 |
Dec 2011 |
Mar 2011 |
Oct 2010 |
|
|
|
|
|
|
|
|
|
|||||
|
I'm definitely looking to buy |
8.4% |
9.2% |
5.9% |
6.8% |
6.8% |
5.7% |
5.6% |
5.1% |
5.7% |
6.2% |
6.5% |
8.0% |
|
I may buy |
20.0% |
18.0% |
14.5% |
15.4% |
13.5% |
12.6% |
11.3% |
13.0% |
17.2% |
17.9% |
16.0% |
19.4% |
|
I'm definitely going to sell |
3.0% |
3.4% |
4.0% |
4.1% |
3.6% |
4.5% |
4.0% |
5.0% |
4.5% |
5.0% |
4.5% |
4.7% |
|
I may sell |
9.0% |
8.6% |
10.6% |
9.4% |
9.6% |
9.2% |
7.9% |
10.3% |
10.2% |
12.4% |
9.5% |
8.3% |
|
None of these |
41.7% |
45.3% |
53.5% |
53.0% |
56.3% |
56.9% |
56.3% |
54.9% |
55.3% |
48.3% |
50.9% |
37.1% |
|
I really don't know |
24.2% |
22.2% |
19.9% |
19.5% |
15.9% |
16.4% |
19.8% |
17.7% |
13.6% |
17.8% |
19.6% |
22.5% |
|
|
|
|
|
|
|
|
|
|
|
|
|
|
|
|
|
|||||||||||
|
Total buy |
28.4% |
27.2% |
20.4% |
22.2% |
20.3% |
18.3% |
16.9% |
18.1% |
22.9% |
24.1% |
22.5% |
27.4% |
|
Total sell |
12.0% |
12.0% |
14.6% |
13.5% |
13.2% |
13.7% |
11.9% |
15.3% |
14.7% |
17.4% |
14.0% |
13.0% |
84,800 dwelling undersupply
The demand estimate for the next 12 months is 131,900 dwellings - down from 144,500 when last surveyed in September 2015. This is equivalent to a national nett shortage – the gap between numbers of definite buyers and numbers of definite sellers - of around 84,800 dwellings to meet demand from those definitely intending to buy – down from the 91,100 reported in September 2015.
Auckland undersupply 41,200
In Auckland there is an estimated undersupply of 41,200 dwellings – a 30% increase on September 2015’s 31,700 dwelling shortfall. This has resulted from an increase in definite buying intention from 10% in September 2015 to 11.9% in July 2016, with no increase in definite selling intention. These results indicate that unless there is a major correction that results in large numbers of dwellings being released on to the market, there is unlikely to be a reduction in Auckland property prices in the near term.
The total Auckland gap represents 49% of the national undersupply.

Wellington undersupply 8,400
The Wellington Urban Areas continue to show an undersupply, but at a lower level (8,500 dwellings) than in September 2015

Christchurch undersupply 2,800
The undersupply reported in Christchurch in September 2015 has eased slightly from 3,400 dwellings to 2,800 in July 2016.

Sample: 2,177 members of the HorizonPoll national panel, representing the New Zealand population 18+, responded to the survey between 27 June and 12 July 2016. The maximum margin of error at a 95% confidence level is ±2.1% overall.
HorizonPoll Online Survey system
and website developed by BEWEB
Copyright © 2010. HorizonPoll incorporating ShapeNZ - Listening to New Zealand


