News
What's behind local government non voting
11 Nov 22

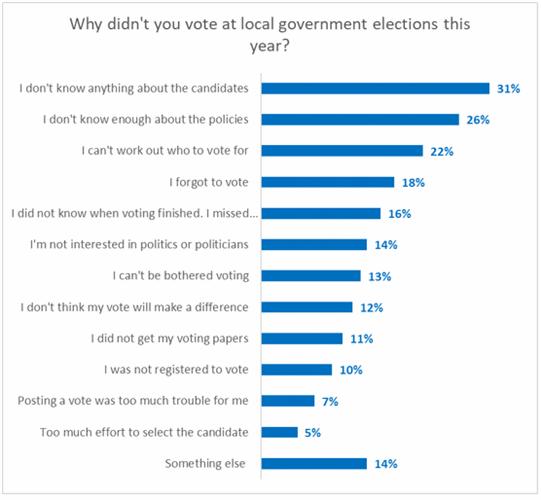
The low turnout of voters in local government elections in October was mostly driven by a lack of information about candidates and their policies, not the voting method.
A nationwide Horizon Research survey finds:
- 31% of non-voters saying they didn’t vote because they didn’t know anything about candidates
- 26% said they didn’t know enough about policies, and
- 22% said they couldn’t work out who to vote for.

14% of respondents had “other reasons” for not voting. The reasons were varied but there are a few who “do not trust the system” or feel their vote won’t make a difference.
Preferred method of voting:
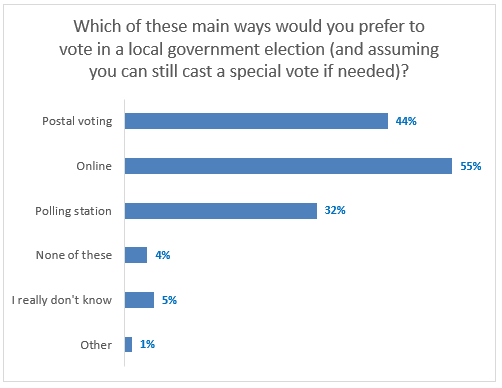
When voters and non-voters were asked which ways they would prefer to vote, 55% said online and 44% said postal voting. Nearly a third (32%) preferred polling stations. (Respondents could select any or all of the options).

At 55%, online voting was the most preferred voting method. This was the most preferred among 35-54 year olds (62%).
At 55%, postal voting was most preferred among 55+ year olds.
Only 25% of under 35s said they would prefer the polling station. Additionally, 9% said they weren’t sure which was their preferred method. This is higher than the total of 4% who said they didn’t know.
A change to include an online voting options might also appeal to non-voters: 59% prefer online voting, compared with 55% of respondents overall.
Security of voting method:
Even though the polling station is least preferred method for voting it is considered the most secure. 60% consider it secure.
However, 43% thought both postal voting, used now and online voting (not used universally now) were secure.
68% of over 55s trust the polling station to be secure versus 51% of under 35s.
Comment:
Horizon says results indicate the key to lifting local election turnout is giving potential electors more information on candidates and their policies.
Better administration and communications could also help overcome these issues with non-voters:
Not registered (10%)
Not receiving voting papers (11%)
Forgetting to vote (18%)
Not knowing when voting finished (16%).
Moves could also be made to address apathy among non-voters:
Not interested in politics of politicians (14%)
Can’t be bothered voting (13%)
My vote won’t make a difference (12%)
Too much effort to select a candidate (5%).
A change to include an online voting options might also appeal to non-voters: 59% prefer online voting, compared with 55% of adults overall.
Horizon Research Principal Graeme Colman says changing the voting method won’t be the main driver of behaviour change to lift election turnout.
“The country might have to consider how we help either local authorities or other agencies fund and get detailed information on all candidates to electors - and more effectively communicate on registering, voting deadlines and why people should be bothered to vote.”
Even though the polling station is least preferred method for voting it is considered the most secure. 60% consider it secure versus 43% saying online or postal voting are secure.
68% of over 55s trust the polling station to be secure versus 51% of under 35s.
Methodology:
Local government election voting closed on October 8, 2022. The survey was conducted between 20 and 25 October 2022. The online survey sample of 1,151 respondents is weighted on age, gender, Party Vote 2020, education, ethnicity and region to represent the New Zealand population aged 18 or more.
It has an overall margin of error of ± 2.9%.
Horizon conducted the research in the public interest.
To be heard in Horizon polls you're welcome to join our research panel.
Contact:
Graeme Colman, Principal, Horizon Research, email gcolman@horizonresearch.co.nz, telephone 021 848 576.
HorizonPoll Online Survey system
and website developed by BEWEB
Copyright © 2010. HorizonPoll incorporating ShapeNZ - Listening to New Zealand


